
There are no final results of the State Duma elections yet. The Central Election Commission has not yet published protocols for all polling stations: by the evening of September 23, there is no data for the Leningrad region and for the occupied regions. However, the available data is already enough to see how the current vote differs from previous ones. In short: these were the most dishonest of all the Duma elections of Putin’s time. And even they look more “normal” compared to the 2024 presidential elections. And, apparently, support for United Russia has surprisingly remained almost unchanged since 2021. Now more details.
In March 2024, Meduza analyzed the Russian presidential election in detail and discovered anomalies of unprecedented proportions in the voting results. In particular, in the distribution of polling stations by turnout and winner’s results, huge peaks on round values were visible to the naked eye, and the “normal” core of polling stations with average values simply disappeared from the distribution, turning into a solid “tail of a comet.”
The results of the current Duma elections differ in this regard: both in the result of the leader and in the turnout and distribution of votes. However, it is not entirely correct to compare the results of presidential and Duma voting, if only because in one case they vote for a person, and in the other for a party. Further in the text we will mainly talk about comparing the 2026 elections with other Duma campaigns.
And one more note before moving on to the pictures themselves - regarding the use of the terms “anomalies” and “falsifications”. Both words can, and often do, refer to the same event, but have fundamentally different perspectives on it. We mainly use “anomalies” in the text.
Anomalies are a purely statistical term that refers to deviations that do not fit into the expected behavior of voting participants. Even if we don’t know the reasons for the anomalies, we can document them—if, of course, we agree on what kind of voting behavior should be considered “normal.” Falsification is a legal term, directly described in the criminal code and relating to documents and voting results (Article 142 of the Criminal Code of the Russian Federation).
By themselves, no anomalies can be automatically interpreted as falsifications. Although most often there is no magic here, and behind the obvious anomalies in the distribution of votes there really are falsifications (which, for example, disappear if there is an observer in a polling station with a previously abnormal turnout). But this connection between the anomaly and falsifications can only be proven in court, where statistical arguments are not accepted, and only eyewitness testimony is taken into account (well, at least theoretically).
The big picture: the “tail” has become the “body”
The pictures below show the distribution of voting results by party lists in the current elections to the State Duma and in similar elections in 2021. For the current elections, preliminary results are shown for 82,124 PECs (approximately 85% of the total). In the diagrams, dots of the same size show all PECs with published protocols. For each PEC, the horizontal coordinate shows turnout, and the vertical coordinate shows the result of the United Russia party in this area.
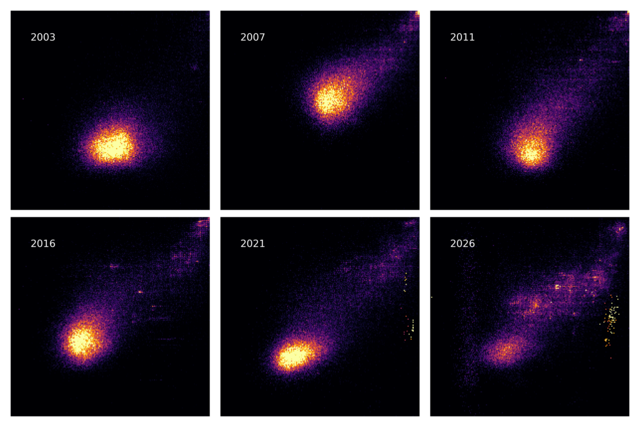
It can be seen that in the last Duma elections, the bulk of the polling stations are grouped in the core areas - where the turnout is about 35-40%, and the result of United Russia is about 30%. The remaining areas form a “comet tail”, going to the right and upward - in them, the increase in turnout clearly correlates with the increase in the results of the ruling party. In the same picture, a square grid of “beautiful values” is clearly visible, where turnout and results are unnaturally grouped around round indicators.
The results of the current elections compared to past ones are fundamentally different in one thing: the “tail of the comet” has become heavier and turned into a complex multi-cluster “body.” But its core, although preserved (which distinguishes these elections from the presidential ones), became much smaller and thinner.
With all these changes, attention is drawn to the fact that the position of the core itself has remained practically the same over the past years - it has only moved slightly upward. If we interpret the voting results at such polling stations as “true” or “unfalsified,” then we must admit that the electoral result of United Russia has increased by about five percentage points since 2021: from ~30% in 2021 to ~35% in the current elections. Overall, this is a reasonable interpretation, but it has a few subtleties, which we will discuss below.
Picture by region: “Moscow Pillar”
One more innovation can be seen in the results of the current elections: this is a sparse vertical “column” of PECs, located to the left of the main cluster. If you highlight the precincts by region in the same distribution, it becomes clear that these are PECs of “paper” voting in Moscow.
The diagram shows that the distribution of voting results in Moscow has completely changed since 2021: a symmetrical round cluster of polling stations has moved to the left and turned into a vertical “column.”
The shift towards lower turnout in Moscow is quite understandable - it is due to the fact that a significant part of the capital’s voters (almost 78%) voted remotely rather than coming to the polling stations.
But what uniform stretching of the cluster according to the result means is not entirely clear. This is definitely not due to ballot stuffing - in this case, the cluster would stretch into a regular “comet tail.” There is also no primitive rewriting of protocols to fit beautiful values (then horizontal condensations on round values would be visible). This result could be explained by the transfer of protocols to the winner’s pile or voting under administrative pressure - but the uniformity of this possible pressure and the absence of noticeable concentrations in the “Moscow pillar” require additional research.
The same graph shows that voting results have changed significantly in other regions. For example, in St. Petersburg, the 2021 vote was very similar to Moscow in terms of turnout, results, and distribution - which is absolutely expected, given that we are talking about two metropolises that are similar to each other. But in 2026, St. Petersburg “left” in the opposite direction from Moscow, doubling the turnout and results of United Russia. Also, in the distribution of St. Petersburg PECs, small clusters appeared, scattered throughout the diagram. It is difficult to say exactly what explains this without additional research.
There are also stable regions on the graph - for example, in Chechnya, virtually nothing has changed over the past five years.
Dynamics by year: the Duma elections under Putin have never been worse
Comparing the results of similar votes in the same regions is also important in the sense that without it we would not understand which votes are “normal” and which are “abnormal”.
You can often hear that only areas that fall into the normal distribution are “normal” (in the sense of the absence of falsification) - that is, the “bell” described by the Gaussian function. And all the rest, accordingly, are explained by the result of falsifications. On this basis, it is usually concluded that the result obtained in the cometary nucleus is the “true” result in the sense of the result in areas without falsification.
This is wrong.
A fair distribution of votes in polling stations in an abstract country can be anything, not just Gaussian - Gaussian implies a random distribution of polling stations by size and random behavior of each individual voter in accordance with his own preferences.
Turning to the experience of elections in other countries shows that the distribution of results and turnout, even in fair elections, can differ greatly from Gaussian due to the characteristics of a particular country.
For example, in the 2011 Canadian parliamentary elections, the distribution of results was clearly bimodal, that is, with two clusters of precincts - due to the fact that English-speaking and French-speaking Canada voted very differently due to their very different attitudes towards the leading party. And, for example, in the parliamentary elections of the same year in Finland and Poland, it was possible to record a clear, although very different, correlation between turnout and the leader’s result. A similar correlation is given by the stuffing that is well known to the Russian citizen - but in these countries such a correlation does not indicate false stuff, but rather the fact that people who more often vote for the party in power go to the polls with greater enthusiasm (which, in turn, is related to traditions and the geographical distribution of the population).
The official CEC also says that the non-Gaussian nature of the voting results does not indicate falsification. But the election commission’s thesis is broken by the historical comparison of parliamentary elections in Russia. Although some, very small shift to the right (with a correlation between turnout and outcome) was noticeable in Russian elections even before widespread fraud, it does not explain what has happened to elections now.
The graph below shows the results of the last six Duma elections. It clearly shows how the very close to normal distribution of turnout and votes in 2003 turns first into a “comet” with a core and a tail, and then into something where it is difficult to identify a cluster of “Gaussian areas” and which is generally difficult to describe in words. The geography and population structure have not changed fundamentally over the years, but the technologies for counting votes have changed.
Peaks at beautiful values: there are many more of them
One of the most striking types of statistical anomalies that indicate protocol rewriting is peaks at “beautiful values.” With an honest count of ballots, the appearance of such peaks is impossible. More precisely, these peaks can occur (due to small numbers of votes in high-turnout areas), but their height is strictly limited and can be calculated using statistical methods. Anything above some random threshold is definitely an indication of interference with the fair count.
The graph below shows a comparison of the height of the turnout peaks (above) and the result (below) in the distribution of votes by PEC in the current and past parliamentary elections. Here you can see that not only the “tail of the comet” has become significantly thicker (especially in the distribution of the result), but also the peaks in the round values have grown significantly.
If we compare these elections with the 2003 elections, it becomes clear what the vote count should look like without substitution of protocols.
Using the methodology developed by Dmitry Kobak, Sergey Shpilkin and Maxim Pshenichnikov and published in the journal Significance, we calculated the number of PECs with abnormally round results and turnout values. As it turned out, since the last parliamentary elections it has almost doubled - from 1300 to almost 2250 polling stations. And this, we repeat, does not include the 15% of areas for which there are no protocols or did not exist until recently.
Recording anomalies in elections is necessary and important, but very difficult work that requires attention, painstakingness and perseverance. If you, like us, think that such work must be done, please support Meduza with a donation.
Department "Analysis"

